October 2018
Crowdsourced measurements can reveal all sorts of interesting insights about networks, and one metric that's of interest to mobile operators is relative cell size - the coverage area each cell can achieve.
For mobile operators this is an important metric to understand as it gives insights into how cell sizes vary based on which frequency band is being used and where to invest in order to best impact on user experience. For example: an area covered by long range macro-cells may be receiving poor user experience and therefore may be considered for small cell deployment (useful for 5G rollout).
One way of understanding relative cell size is by looking at a network's "timing advance".
|
About Timing Advance This “timing advance” is a fair estimate of the distance of the mobile from the At Tutela we collect timing advance as part of our crowdsourced network |
The chart below shows the average relative cell size for each of the four UK mobile operators versus the frequency band that the handset was using based on average timing advance. For example, it shows Three's 1800MHz cells have a coverage area of around 30% of their 800MHz cells - or alternatively that they need slightly more than three 1800MHz cells to cover the same areas as one 800MHz cell.
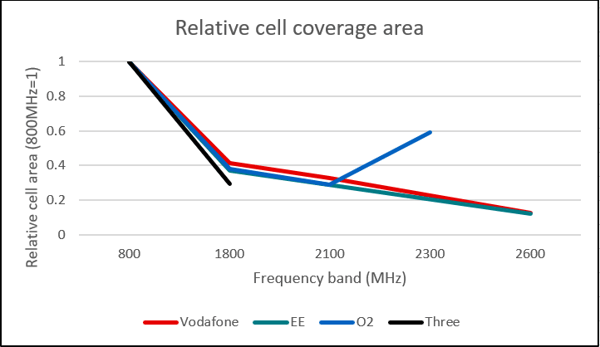
What does this chart tell us?
Firstly, that cell coverage decreases as frequency increases. This isn’t news, of course, it’s very well known that higher frequencies propagate less far. There’s a huge difference between 800MHz and 1800MHz - not surprising given that 1800MHz is more than twice the frequency of 800MHz. The difference between 1800MHz and 2600MHz is much less but still noticeable. Secondly, all operators are getting very similar performance. Thirdly, not all operators are using all bands, in particular Three only appear to have significant deployments at 800MHz and 1800MHz.
We can also see a clear anomaly - the coverage that O2 are getting from 2300MHz appears better than even 1800MHz. There’s no obvious technical reason for this suggesting that the cells at 2300MHz are probably being inappropriately extended, such that those on the cell edge get poor performance. This might be expected for new frequency bands like 2300MHz, initially sparsely deployed, where handover boundaries are still to be optimised. Or it might indicate the difficulties in making TDD work for an operator used to FDD optimisation.
The impact on 5G
This also points to potential issues with 5G frequencies at 3500MHz. Extrapolating the chart, these higher frequencies might only have a coverage of around 5-10% of an 800MHz cell, or less than 25% of an 1800MHz cell. The industry is hoping that massive MIMO antennas will overcome this somewhat with beamforming but by how much remains to be seen. 3500MHz is also likely to be used in TDD mode, suggesting that there will be a lot of trial and error as the operators optimise their network with new frequencies, new antenna technology and new duplexing. Expect it to take some time for 5G networks to settle down and outperform 4G.
The need for crowdsourced data
In summary, higher frequencies inevitably mean smaller cells, and the frequency band for 5G at 3.5GHz is much higher than the bands currently used. This means that 5G coverage will be limited to urban areas and might even be spotty in these. Getting new bands to work well takes time especially given the new technologies of TDD and smart antennas so early deployments may be significantly below theoretical performance, perhaps not even as good as the best 4G deployments. There is much uncertainty here, and crowdsourced data can provide real-time insight into what is being deployed and what is working well globally. With the immediacy of crowdsourced data, we will be able to tell as soon as 5G frequencies are in use and monitor the cell range that the operators achieve over time. If it is less than expected it could make 5G deployment hugely more expensive than hoped. Having access to this insight could make all the difference between 5G leadership and 5G ignominy.
Written by Professor William Webb
| William is one of the leading voices in the wireless industry, having literally written the book on 5G technology. As a consultant for Tutela, William helps to shape our business solutions for mobile operators, ensuring our technology is able to make the biggest impact to real world user experience. Find me on LinkedIn |
|
.png?width=146&name=Untitled%20design%20(12).png)