February 2021
As the world continues to grapple with a pandemic that has forced everyone to remain at home, mobile and internet usage has increased more than ever. With people working from home, kids attending school online, and virtual events replacing in-person gatherings, the ever-present issue of network congestion has become more critical than before.
For operators competing in the 5G era, identifying locations and times when a network experiences the worst congestion is crucial. Equipped with this knowledge, operators can invest in enhancing and strengthening their network in locations that will be most impactful for improving performance.
To demonstrate the power of crowdsourced data in congestion analysis, we used Tutela Explorer, a tool that can analyze and visualize huge amounts of data in real time, to investigate congestion issues for major mobile network operators (MNOs) in Poland. Data used for this analysis was collected between May 18th, 2020 and January 18th, 2021.
|
Analysis findings
|
Comparing download to upload speeds
Percentage of tests where download throughput < upload throughput
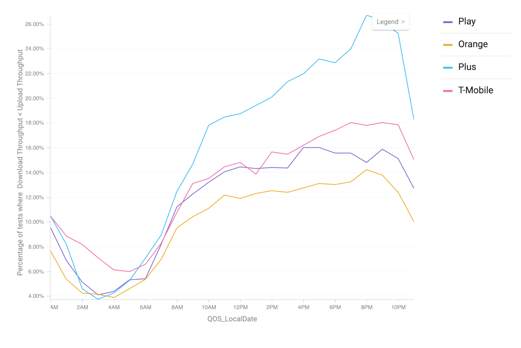
One of the metrics to identify network congestion is a comparison between download throughput and upload throughput. Typically, download speed is higher than upload speed and an inverse scenario could indicate congestion. While examining this metric for Poland, we can observe that the percentage of tests where download speed is lower than upload speed increases consistently as the day progresses reaching its peak at about 9 pm.
Across the country, Orange has the lowest proportion of upload faster tests followed by Play and T-Mobile, with T-Mobile’s network worsening after about 4 pm. Notably, while the proportion of tests for Plus are on par with other national operators during the off-peak hours of 1 - 6 am even continuing till 8 am, it sees the greatest change as compared to others, reaching its peak at 9 pm with almost 26 percent of tests where download speed is lower than upload speed. This indicates a congestion problem during high traffic hours and that its network struggles as the traffic increases.
At peak, up to 13 percent of tests have a download throughput < 1.5 Mbps
Percent tests where download throughput < 1.5 Mbps
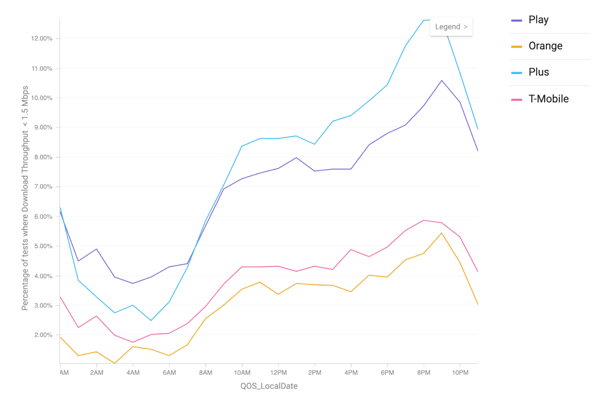
As well as considering the relative performance of a network, we can also use Explorer to analyze changes in absolute performance from on-peak to off-peak. If the download speed is lower than 1.5 Mbps, which is the minimum acceptable throughput for Tutela’s Core Consistent Quality metric that represents common but less-demanding use-cases like standard-definition video streaming or web browsing, it can be an indicator of network congestion.
The pattern for download speed observed here is somewhat similar to the pattern for the first metric in terms of operator rankings. While Orange again experiences the lowest network congestion according to this metric, followed by T-Mobile, Plus and Play trade positions for being the operator with the highest network congestion during off-peak and on-peak hours.
During off-peak hours between 1 am to around 7 am, Play has a higher proportion of tests that are slower than 1.5 Mbps. Play and Plus are on par between 7-10 am; however, Plus experiences a spike in the percentage of tests with download speed lower than 1.5 Mbps after 10 am. Although all the operators see a surge in the proportion of tests conforming to this metric during on-peak hours, Plus has the highest proportion with about 13 percent of tests on its network having speeds lower than 1.5 Mbps at its peak.
The proportion of tests with download throughput lower than 1.5 Mbps can depict a network’s underperformance in absolute terms. However, assessing the percentage slowdown in download throughput during off-peak versus on-peak hours helps us identify instances when the drop in speed is being caused due to congestion even though it may not be at such critical levels as the 1.5 Mbps threshold.
Download speeds drop by up to 44% during peak hours
Percentage slowdown in average download throughput on-peak vs. off-peak 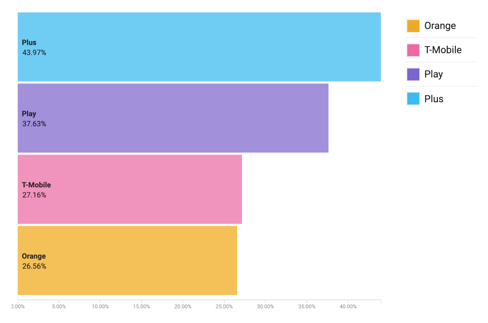
Examining the download speeds monitored during off-peak and on-peak hours, we can see that Plus again stands out with the highest percentage slowdown in average download throughput during peak hours at 44 percent. This slowdown is possibly a indicator of a high volume of data traffic leading to congestion.
Percent slowdown in download throughput on-peak vs. off-Peak - Poland

An overarching geographic analysis of Poland illustrated through the above map shows areas of the country that are most affected by a slowdown in download throughput during on-peak hours likely due to congestion. Areas denoted by green and yellow points have a relatively lower slowdown in download throughput compared to areas represented by red points.
The majority of the cities have varying degrees of congestion. For example, Warsaw, Lodz and Wroclaw seem to have very good network performance in some parts while some pockets denoted by red points experience higher congestion. On the other hand, Poznan and Zielona Gora in western Poland, Gdansk in the north as well as Lublin and Białystok in the east have a higher number of pockets with worse congestion. In the south, the city of Gliwice with pockets dominated by green and yellow indicating far better network performance in terms of lower congestion as compared to other cities.
Future improvements
Improvements in network performance through 5G deployments and site densification are promising solutions to reduce congestion problems. All the major operators in Poland have now deployed 5G to some extent; however, those networks use spectrum that has traditionally been available for LTE, and does not offer the same massive increase in capacity that can be achieved with higher-band (and even millimeter-wave) 5G, as is being employed in some other countries.
For that, operators will have to wait: in November 2020, the Chancellery of the Prime Minister of Poland announced a new proposed a deadline of August 27th, 2021 for allocating 3400 - 3800 MHz spectrum bands. These are positive steps towards creating a robust network that will certainly help ease current congestion issues, and provide ample capacity for the next generation of wireless networks.
However, there is a trade-off: real-world deployments of 5G in the 3.5GHz bands have shown coverage substantially less than that achieved with lower-band LTE signals. In order to maximise the benefit of new frequencies, operators need to use targeted analysis of large data sets to surgically target new 5G sites to where they are needed the most.