July 2020
With 5G capabilities inside the vast majority of this year's flagship smartphones, and next-generation networks being deployed around the world on a daily basis, 5G has moved from being a promised possibility to a very tangible reality. With 5G deployments, however, comes a question from the general public: what's the point of the upgrade?
While the possibilities of 5G extend to a dizzying array of use-cases, the most tangible immediate benefit is the capacity improvement of 5G. Operators have deployed hundreds of MHz of new spectrum for 5G networks, vastly increasing the amount of capacity available for users. This will be felt the most in areas where 4G networks are already at their limits, and users are seeing degraded performance at the busiest times.
To see where 5G networks might offer the greatest improvement in the Nordics, Tutela evaluated congestion across hundreds of municipalities and tens of operators. To do this analysis, we looked at two key metrics. The first is the percentage slowdown in download speed (measured using a 2MB file size, with data from the last six months; over 16 million download tests considered from over 500,000 users) from off-peak hours to on-peak hours. This metric shows how much the performance of a network degrades due to heavy usage: if we know that high peak speeds are technically available, but not frequently experienced during peak hours, we know that the network is being slowed down by the number of users trying to access data simultaneously.
On its own, however, the slowdown in download speed does not show poor performance, as network speeds could degrade significantly during on-peak hours, but still be perfectly usable. In fact, this situation is quite likely, as improving the capacity of a network (to handle heavy on-peak load from thousands of users) will often improve the peak speeds achievable on a network when it is completely unloaded — for example, the middle of the night around a busy train station.
To tackle this, we use a second metric: the percentage of download tests during peak hours that are slower than 1.5 Mbps (the speed commonly required for streaming standard-definition video). Since average speeds on networks in the Nordics are frequently above 20 Mbps, a result of less than 1.5 Mbps in a built-up area is strongly indicative of a congestion problem.
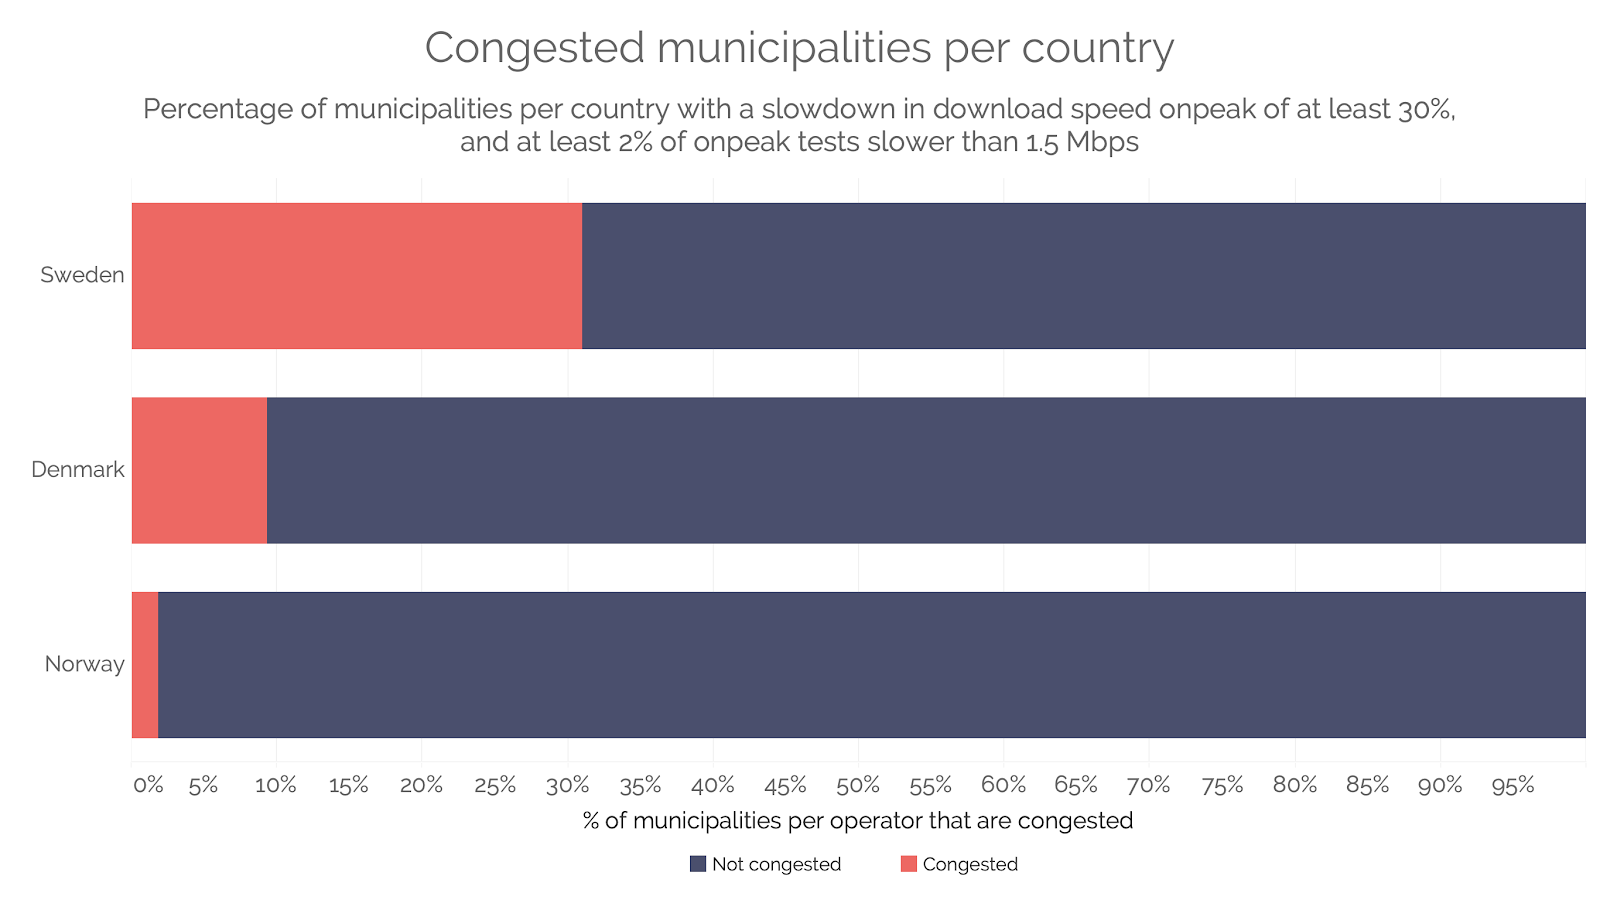
To quantify what proportion of municipalities in each country are congested to some extent, we set two thresholds: a slowdown in download throughput of at least 30%, and at least 2% of onpeak tests slower than 1.5 Mbps. We considered these thresholds for every city for each operator, and the below chart shows the proportion of municipalities/operators that can be considered congested, by these metrics. Looking at this chart, a clear picture emerges: over 30% of city networks in Sweden are congested, compared to under 5% in Norway.
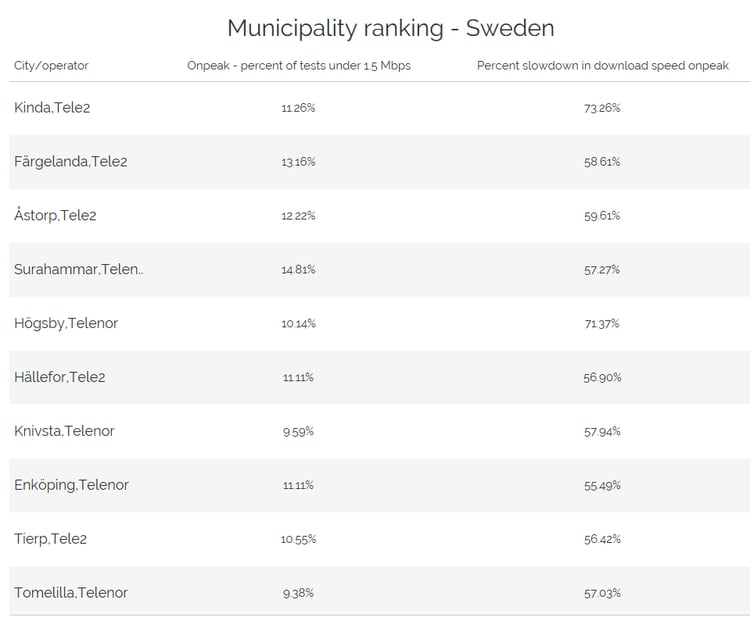
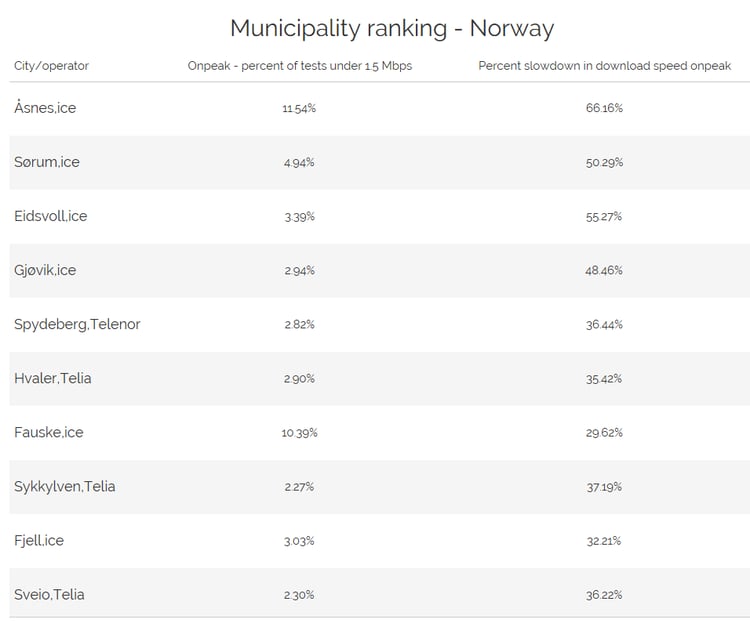
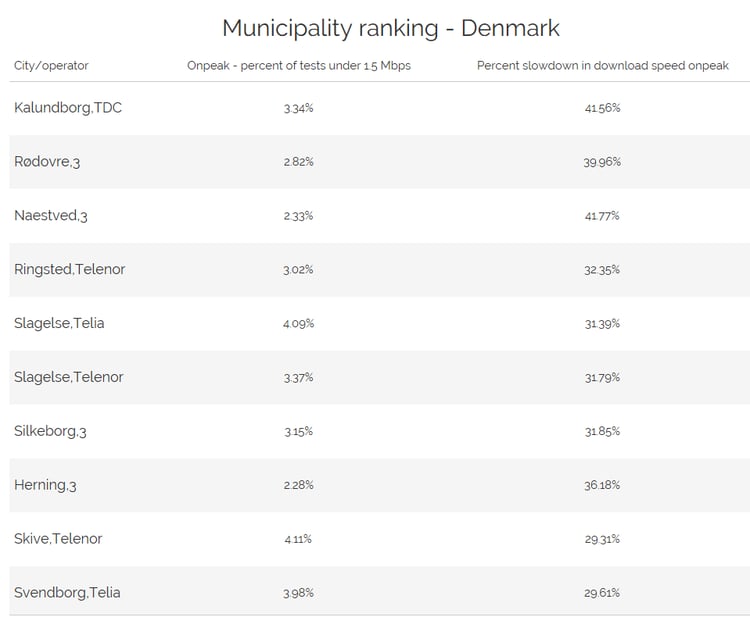
To examine this problem further, we looked at the ten most-congested networks in each country. This is based off a combination of the percentage slowdown as well as the percentage of tests under 1.5 Mbps, which combine to show (from the worst downwards) the most congested networks in each country. It’s interesting to note the gap between countries — Norway’s most-congested network would barely make the list in Sweden!