May 2020
Tutela uses two flagship metrics, Excellent and Core Consistent Quality, to evaluate mobile experience on wireless networks around the world. You can read more about Consistent Quality here, but put simply, each metric is made up of five underlying Key Performance Indicators (KPIs): download throughput, upload throughput, latency, jitter, and packet loss.
The metric is designed so that each test taken on a mobile device — which involves measuring each of those five underlying KPIs — is either a pass or a fail. Using a set of thresholds representative of a good performance for common use-cases like HD video calling or mobile gaming, each test is evaluated, and the overall result for the operator is simply the percentage of tests where all five KPIs are above the minimum thresholds.
Excellent Consistent Quality
| KPI | Average download speed | Average upload speed | Latency | Jitter | Packet loss |
| Minimum acceptable value | 5 Mbps | 1.5 Mbps | 50 ms | 30 ms | 1% |
The rationale behind this is that beyond a certain point, a faster download speed or a lower jitter don’t matter to subscribers. Most smartphone users don’t care about their Mbps, but instead whether or not they can video call their friends, or play Fortnite.
From the perspective of Excellent Consistent Quality, therefore, there’s no difference between a download speed of 6 Mbps or 60 Mbps — both are a pass. That can lead to instances where one operator or country might be ahead of its competitors in terms of average download speed (or any of the underlying KPIs), but still behind when measuring using Consistent Quality.
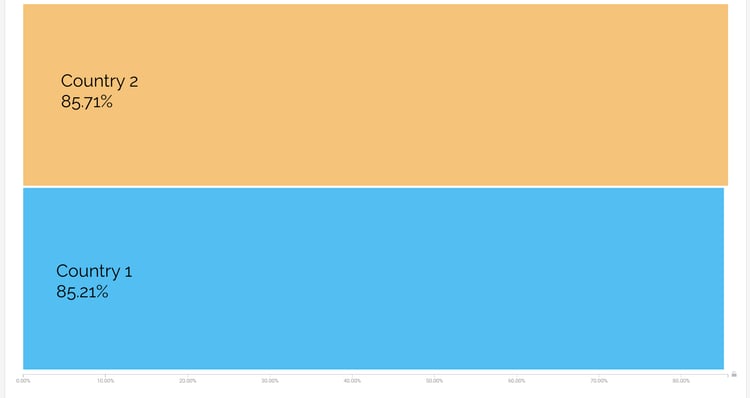
As an example, we’ve picked two neighbouring countries that have relatively similar rates of cellular penetration. Using Tutela Explorer, we can see that Country 2 is slightly ahead for Excellent Consistent Quality.
Excellent Consistent Quality
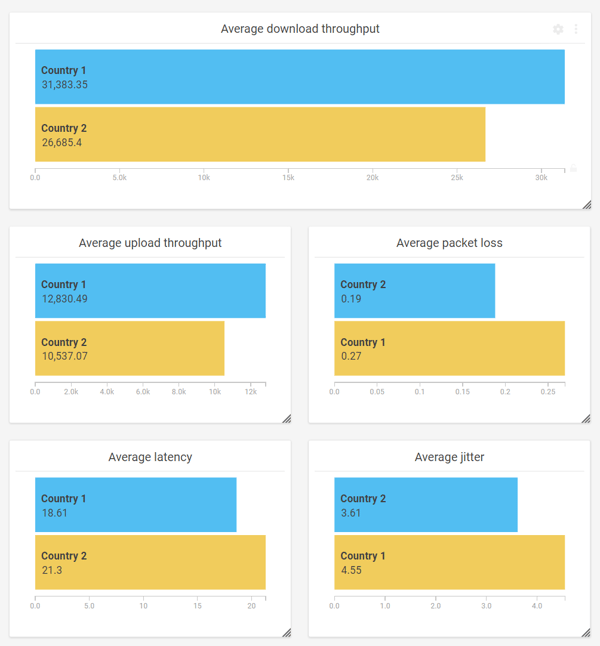
When looking at the underlying KPIs, however, a different picture of network performance emerges. Country 1 has a better average for all five of the underlying KPIs, including a mean download throughput nearly 5 Mbps faster.
At first glance, it may seem illogical that one country can have better average performance across all KPIs, but a worse performance on a metric that aggregates those KPIs. The answer, however, lies in the distribution.
Using Tutela Explorer, we can use a histogram to examine the distribution of download tests across the two countries. Although Country 1 has a higher mean download speed, with a significantly higher proportion of results above 30 Mbps, its distribution skews further left, resulting in a slightly higher percentage of tests below that 5 Mbps threshold.
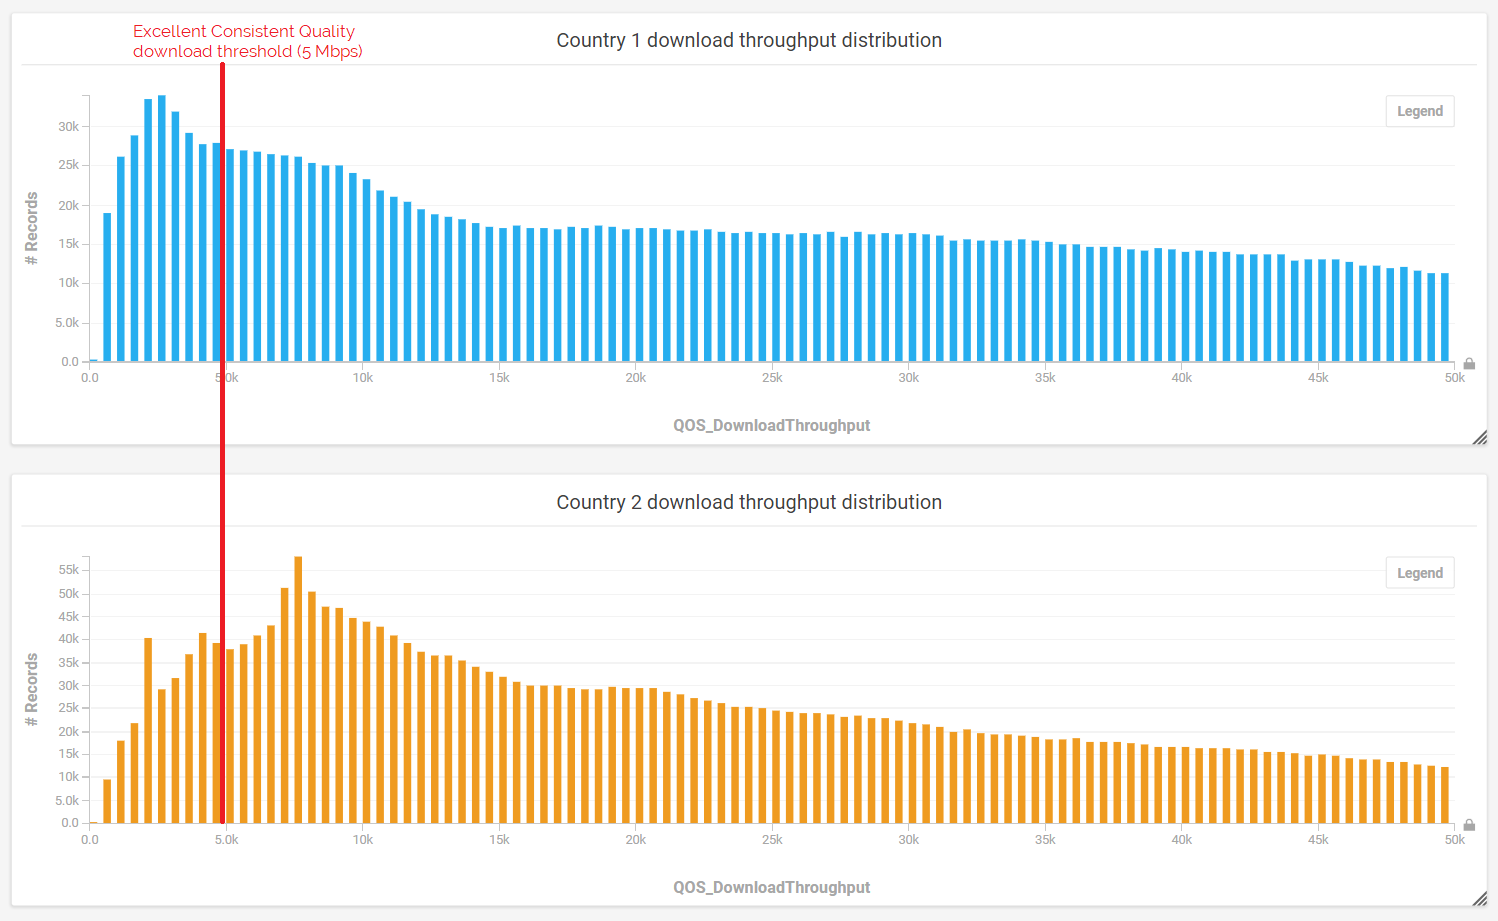
Since Consistent Quality is a binary metric, it only matters what proportion of tests are above or below the threshold (the red line in that graph), not how far above or below the threshold they are. Therefore, it’s quite possible (and happens not infrequently!) that an operator or country can have better average results in all the individual KPIs, but come second to a competitor for Consistent Quality. In essence, the consistency of their results (above the threshold) is lower, even though their average is higher.
Of course, analysis of the underlying measurements is important, and Consistent Quality is just one tool to use to evaluate mobile experience. That’s why our public reporting contains a range of metrics, and why tools like Tutela Explorer are so important for deeper analysis of top-level findings.